Competition is the driving force behind the success of markets. It’s hard to imagine a thriving market economy without the presence of competitive forces.
But how do we actually measure competition? I use the term all the time, but do we actually have a measure of it? This question is more complex than it may seem at first glance.
Competition as Lack of Concentration
Unfortunately, there is no universal measure of competition. The way we quantify competition is highly dependent on the economic model we use.
For instance, in a Cournot model (named for the 19th century French mathematician Antoine Augustin Cournot), the number of sellers in the market is seen as the primary indicator of competition. When we ask, “What happens when competition increases?” what we usually mean is, “What happens if more sellers fall from the sky?” This makes sense within the context of the model, as more sellers compete to drive down prices, markups (price over cost), and profits. If we observe low prices and low profits in a market, it seems plausible to conclude that the level of competition is high.
If you—like me—don’t like the idea of firms falling from the sky, you could instead imagine the firms paying some fixed cost to enter the market, and then competing as in the Cournot model. If the entry cost drops, more firms will enter, and profits and markups will drop. If we can get a measure of entry costs, when they drop, that seems like “more competition.” Unfortunately, often the best we can do is to back out entry costs from what we observe from the firms that are in the market. Otherwise, maybe concentration is still our best proxy for entry costs.
But this neat connection between entry costs to concentration to competition doesn’t hold in general. I’ve spent too many newsletters on the problems with concentration as a measurement of competition, so I won’t babble on about that. The tl;dr is that, in commonly used models, competition can actually lead to increased concentration.
For example, think of firms deciding whether to enter local markets. It takes money to operate in each separate market. When these types of trade costs are reduced, the least-cost producer can capture a larger share of the overall market, leading to higher concentration, but also to lower prices, markups, and profits.
Competition as Lack of Markups
Another way to define competition is as the absence of market power. What is market power? The textbook definition of market power is a firm having the ability to influence the price at which it sells its products. If a firm has market power, it will also have a markup where the price is above marginal cost. So, you can measure either the elasticity of demand or the markup to get a sense of competition.
This isn’t perfect either. As I’ve explained before, we shouldn’t assume rising markups means weakening competition. This amounts to reasoning from a price change, since the markup is a type of residual price received by the seller. Prices can rise for demand reasons or supply reasons. We cannot tell simply by looking at the price.
Similarly, markups can rise for demand reasons, supply reasons, or a lessening of competition. For example, if there is a large monetary stimulus, you could expect demand to increase, and likely prices and markups will increase, as well. You could say that this monetary stimulus lessens competition somehow, since there is less relative competition for each dollar. But I think that’s a confusing way to talk about competition. Instead, we should say the markups were caused by increased demand.
Competition as Efficient Reallocation
So, what is a better way to measure competition? I propose that we look at the allocation of market share to more productive (lower-cost) producers. This idea holds true in both Cournot and trade models. In highly competitive markets for both classes of models, we should see output shifting toward the most efficient producers, resulting in declining prices.
One specific measure that captures this concept is the covariance between market share and productivity, also known as the Olley-Pakes (OP) covariance term (the same G. Steven Olley and Ariel Pakes mentioned in my last post).
Before getting to competition, let’s first discuss what we mean by productivity. Productivity measures how much output a producer obtains from a unit of input. It’s a gauge of efficiency. While there are many ways to calculate productivity (marginal productivity of labor, average productivity of labor, total factor productivity), they all take the form of output divided by input.
An important fact about productivity is that it differs immensely between firms, even within narrowly defined industries. Chad Syverson finds a difference between the 10th and 90th percentile in 4-digit industries of around 2x. The 90th percentile firm can produce about twice as much as the 10th percentile firm from a given amount of inputs. While the exact numbers differ, there are massive productivity differences across time and across countries. In China and India, Chang-Tai Hsieh and Peter J. Klenow find a productivity difference of more than 5x.
The key question is whether the market share is random, or whether it’s correlated with productivity. Do more productive firms win market share? If so, then overall productivity and output in the economy will increase as the market optimally allocates resources. If not, then economic growth and the dynamism we associate with competition will be much harder to achieve.
This is where the OP-covariance term comes in. It measures precisely this relationship. The OP decomposition shows that aggregate productivity can be broken down into two parts: the unweighted average productivity of firms and the covariance between firm productivity and market share.
![]()
I propose the OP-covariance term as a better measure of competition. Let’s call it OP-Competition. It is a compelling measure of competition, because it directly captures the extent to which more productive firms are able to win market share. This is the essence of what we want from competitive markets—an efficient allocation of resources to their most productive uses.
If this covariance term is positive and large, it indicates that more productive firms are capturing higher market shares—a sign of a competitive and efficiently functioning market.
One of the key strengths of the OP approach is that it effectively separates the technological component of productivity from the allocative component. The unweighted average-productivity term reflects the pure “technology” of firms in the market—how efficiently they can turn inputs into outputs, on average. The covariance term, on the other hand, reflects how well the market allocates market share to more productive firms.
This distinction is crucial, because it allows us to isolate the specific contribution of market competition, as distinct from technological progress. A market could have high average productivity due to having firms with advanced technology. But if market share isn’t correlated with productivity, I wouldn’t consider it a competitive market.
Conversely, a market with lower average productivity could still be highly competitive if the most productive firms are able to capture the largest market shares. Overall productivity requires both: new ideas and market reallocation. This provides a way to separate the two.
Data on OP-Competition
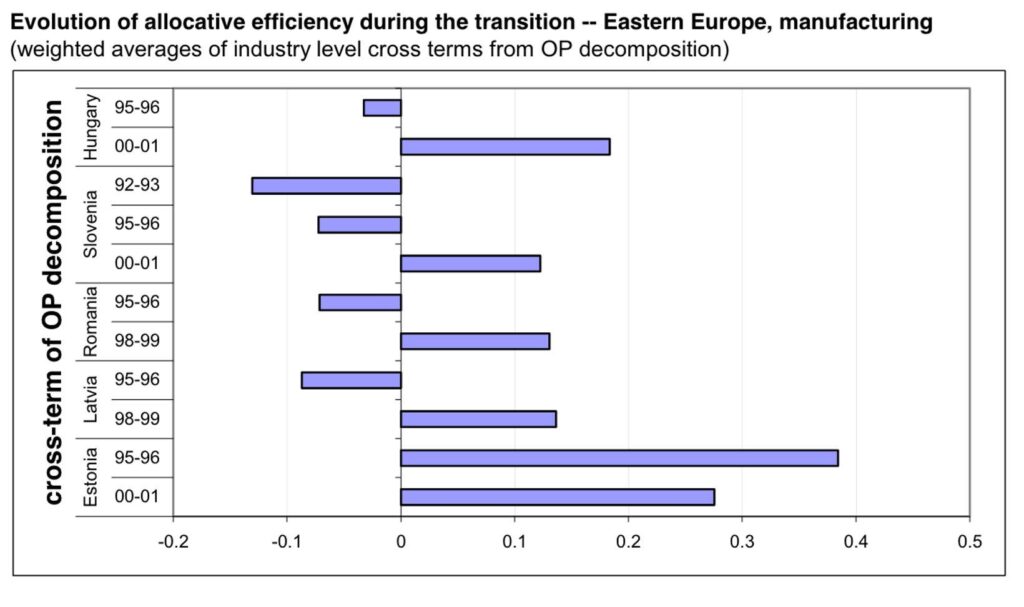
As an initial sanity check on OP-Competition as a measure of competition, we would expect market reforms to increase competition. That’s exactly what Eric Bartelsman, John Haltiwanger, and Stefano Scarpetta found in the data.[1] For example, the OP term was negative in many Eastern European countries in the 1990s (less productive companies captured more of the market). That turned around.
We can dig more into particular countries’ reforms as well. Marcella Eslava, Haltiwanger, Adriana Kugler, and Maurice Kugler study trade, labor, and financial-market reforms in Colombia during the early 1990s. They also see an increase in the market reallocation toward efficient firms.

Finally, if we look across other countries, we can get a sense of the more or less OP-competitive economies. Bartelsman, Haltiwanger, and Scarpetta (2013) look at different countries from 1993-2001. (If anyone knows of more recent data for the United States, let me know!)

By this measure, the United States was far and away the most competitive economy. That’s interesting from a measurement point of view.
But now, I’ll go beyond measurement, to tease a project I’m working on. I believe the fact that the United States is at the forefront in terms of both OP-Competition and GDP is not coincidental. The co-movement reflects, in my argument, a causal relationship between competition and economic growth. Since the OP term is an equilibrium object and from an accounting decomposition, we can’t say that OP-Competition causes GDP growth. Both are caused by something more fundamental that we can’t measure: “competition.” And contrary to popular narrative, the United States is extremely competitive. If you’re interested in more of the argument, I recently gave a talk at Hillsdale on it. Stay tuned for more on that project.
Drawbacks of OP-Competition
As with everything I do, I devoted half of the talk to my argument’s weaknesses. So, let’s close out with some of the problems in my proposed measure of competition.
Like all the measures, OP-Competition is not perfect. It is fundamentally an accounting decomposition, not derived from an explicit model of welfare or optimal resource allocation, although Bartelsman, Haltiwanger, and Scarpetta derive it from a particular model. It requires detailed firm-level data on inputs, outputs, and market shares that can be challenging to collect consistently, especially in the services sector. And making comparisons over time or across countries requires careful attention to measurement issues. There’s a reason the cross-country comparison data is 20 years old.
Even at a conceptual level, the covariance likely understates the full impact of competition on productivity and economic performance. The measure focuses on the between-firm reallocation component and how market shares shift among firms of different productivity levels. But competition also has a within-firm effect, since it spurs firms to innovate, adopt new technologies, and improve their own productivity to stay ahead of rivals.
Imagine a market where competition is so intense that any firm that falls behind the productivity frontier quickly loses market share and is forced to exit.[2] In this case, surviving firms will cluster near the frontier, and the OP covariance may be low simply because there isn’t much productivity dispersion left. Yet this would be a highly competitive market that is driving rapid productivity growth within firms. The OP term doesn’t capture that aspect of competition.
Nevertheless, there’s a strong conceptual appeal of OP covariance as a measure of the allocative efficiency of markets. By separating the technological and allocative components, it provides a lens on the specific contribution of market competition to productivity and economic performance. While no single measure can capture all dimensions of competition, the OP approach offers a valuable tool in the toolkit to assess the functioning of markets.
[1] The published version (2013 AER) does not have this nice figure, so I linked to the working paper.
[2] The OP decomposition doesn’t account for exit. Follow-up papers do, but those introduce other complications that we don’t have time for today.