
In my research and newsletters, I’ve written about how to interpret markups—mostly on the theory side. I haven’t devoted much space explaining the empirics. How high are markups in the United States? Are they rising? If so, by how much?
This post seeks to answer those questions. I’m writing it after reading a new paper by Nathan Miller on “Industrial Organization and The Rise of Market Power,” which is the most recent literature review. Miller focuses primarily on the markup literature from an industrial-organization (IO) perspective. I’ll have more to say about that later. The paper helped me gather my thoughts, but the interpretations and arguments below are all mine. So read this post, and then read Miller.
Buckle up. It’s about to get nerdy.
De Loecker, Eeckhout, & Unger
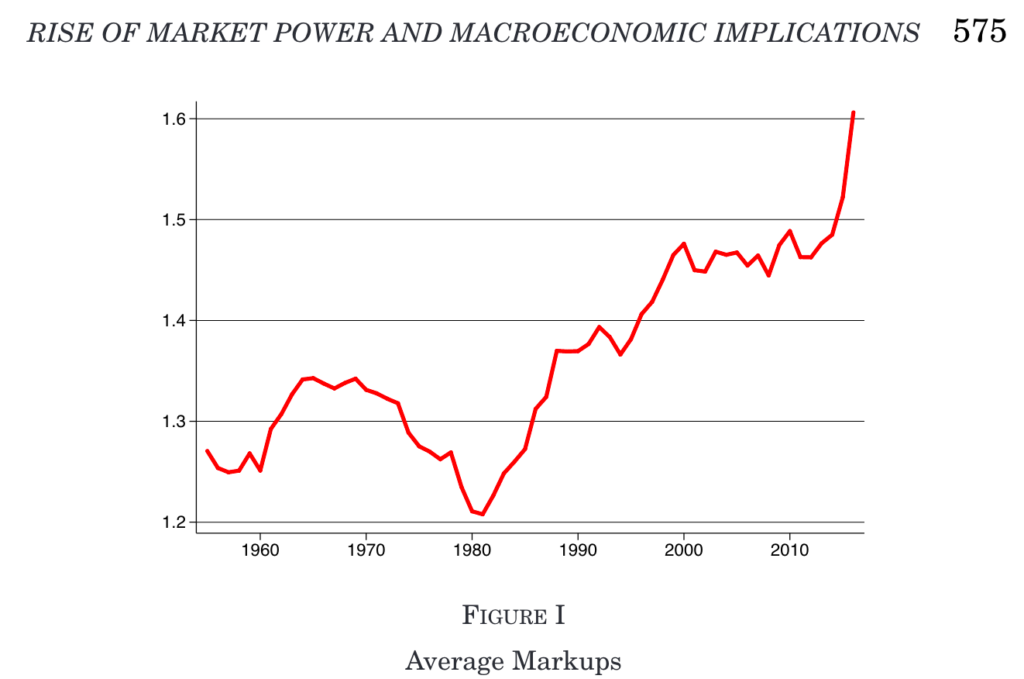
A few years ago, the seminal paper by Jan De Loecker, Jan Eeckhout, and Gabriel Unger (for brevity’s sake, I’ll refer to this paper as “DEU”) found that sales-weighted average markups—the difference between selling price and marginal cost—increased significantly from 1980 to 2016. DEU documents a striking trend: The sales-weighted average markup increased from 1.21 in 1980 to 1.61 in 2016, a rise of more than 30%. This is the figure you may have seen. I’ve shared it before.
Roughly 2,400 citations later, there is a whole literature on “The Rise of Market Power.” Like many, this literature caught my attention.
How do they get their number? DEU used a “production approach” to estimate markups and applied it to a dataset of publicly traded firms, spanning multiple decades.
Here’s how it works: DEU show (drawing on earlier work) that a firm’s markup is determined by two factors: the revenue share of some input (how much of the firm’s total revenue is spent on that input) and the output elasticity of that input (how much a firm’s output increases with an increase in input). For example, if a factory’s production rises significantly with a small addition of labor, labor for that firm has high output elasticity. When an input significantly boosts output and constitutes a large portion of the firm’s expenses, the firm can generally achieve a higher markup.
Interestingly, this markup calculation does not rely on the market structure or interactions between different sellers; whether the market is competitive, monopolistic, or somewhere in between, the principles of how output elasticity and cost share influence markup remain consistent.
This is a powerful result because it suggests that, if you can estimate the output elasticity and observe the cost share, you can recover the markup without observing prices and marginal costs, which are typically hard to measure.
DEU uses accounting data from Compustat, which provides financial statements for publicly traded U.S. firms. They treat the cost of goods sold (COGS) as the variable input. Then, they estimate the output elasticity using industry-level production functions and make several assumptions to control for the unobserved productivity shocks.
This result made waves for a few reasons.
It was the first evidence using firm-level data of a long-term, broad-based rise in markups. Previous papers had looked at industry concentration or profitability trends, but this was more direct evidence of rising “market power.” That’s really important. Concentration is a bad measure of market power.
The method seemed to provide a simple way to measure markups and market power using accounting data and without needing to estimate demand systems, which meant it could be applied very broadly. This had lots of benefits, but one big one is that you don’t need to assume that the nature of competition is constant across industries or through time. Technology, competition, laws—they can all change. You’re just picking up the outcome. That’s a big deal if you want to talk about markups overall.
The rise was huge—a more than 30% increase in markups is a lot! If true, it would have major implications for welfare, inequality, etc. It coincided with a growing policy debate about rising corporate power, declining competition, and the role of antitrust.
In short, DEU was seen as providing the empirical ammunition that those arguing about a rise in market power needed. It’s no exaggeration to say that it defined the empirical debate about market power.
Responses to the DEU Number
The DEU exercise was very clever and seemed simple enough. But immediately, follow-up papers investigated the same question.
As Nathan Miller points out, the production approach used by DEU faces several empirical challenges inherent to the method and the data it uses. Miller frames the discussion around the Compustat data, unobserved prices and quantities, and demand. I’ll stick with those, but elaborate more and add my take.
Compustat Data
I’ll start with the issue I’ve discussed: the paper relies on Compustat data for publicly available firms. Since the focus is not on concentration measures, Compustat here is not as problematic as in some other papers. But the big issue remains that publicly traded firms are not representative of the whole economy. That matters if you’re trying to say something about the U.S. economy and not about just about U.S. publicly traded firms.
In the appendix, they reweight industries by the Bureau of Economic Analysis weights and find similar trends. That’s helpful, but doesn’t solve the problem that, within each industry, publicly traded firms may look different from the universe of firms overall.
But there are debates about how one uses the accounting data that I haven’t harped on before.
There are questions about the appropriateness of using accounting measures like the cost of goods sold to measure economic concepts like variable costs. While DEU explores alternative measures in robustness checks, this measurement issue interacts with the other challenges in ways that are not fully resolved.
In one of the earliest response papers, James Traina points out that the measure of variable costs the DEU uses (cost of goods sold) may not fully capture all variable costs. In particular, selling, general, and administrative (SG&A) expenses likely include some labor and overhead costs that are flexible inputs that vary with output.
When Traina includes SG&A in the measure of variable costs, he finds that the markup rise largely disappears. In fact, markups appear to have declined in some specifications over the period studied by DEU. This result suggests that the markup increase found by DEU is sensitive to the exact cost measure used.
That’s not great.
Including all SG&A in variable costs is also problematic, however, as it likely includes many fixed costs. The truth probably lies somewhere between—some SG&A is variable, some is fixed. Traina’s paper, however, highlights the sensitivity of the markup trend to the exact cost measurement. In theory, it shouldn’t depend on which measure you use, as long as it is flexible. In practice, Devesh Raval shows that, with even better data from manufacturing, the choice of input matters for the estimation.
Suppose you have good firm-level estimates of markups. You still need a way to aggregate them to an overall number. Chris Edmond, Virgiliu Midrigan, and Daniel Yi Xu (2023) start with a more conceptual point about the welfare implications of rising markups. They show that, in their model, welfare costs depend on the cost-weighted average markup, rather than the sales-weighted average markup that DEU used.
The intuition is that what matters for welfare is how much they distort the allocation of resources. If you weigh companies by sales, high-markup firms may have lower costs and still get a larger sales weight. A high-cost firm with a small markup can, however, create more distortion than a low-cost firm with a large markup.
When Edmond et al. calculated the cost-weighted average markup, they found a more modest increase than the sales-weighted measure. That said, they still find an increase in markups over time, even with the cost-weighted measure.
Their paper is an important reminder that the welfare implications of rising markups depend on why markups are growing, and how they are distributed across firms. A markup increase driven by declining costs has very different consequences than one driven by rising prices. I’ve written about this before.
We Rarely Have Price Data
I think the above section is pretty straightforward. Many of you will have seen one or two of these points in discussions of the DEU paper. But now we are getting extra nerdy.
The key object that DEU needs to estimate is output elasticity, which is how much output increases when you increase inputs like materials. In an ideal world, you’d estimate this by regressing the output quantity on the input quantity (assuming you dealt with other problems about firm survival and productivity differences across firms, which we will discuss later). The coefficient would give you the elasticity.
Instead, DEU relies on revenue and expenditure data. But revenue is neither price nor quantity. They observe sales revenue and input expenditures. So, instead of quantities, they effectively regress revenue on expenditures.
Here’s the problem: revenue isn’t just a function of quantity; it also depends on prices. Input expenditures also depend on input prices. So, if firm-specific differences in prices aren’t accounted for, they can bias the elasticity estimates.
Steve Bond, Arshia Hashemi, Greg Kaplan, and Piotr Zoch go so far as to say the “ratio estimator that uses the revenue elasticity in the numerator contains no useful information about the markup at all, and the estimand underlying this estimator is identically equal to one” (emphasis added). If you find a number different from one (as DEU does), you are picking up noise or something else—maybe input market power.
Here’s the intuition for Bond et al.’s result:
In the standard case of a price-taking (competitive) firm, the revenue elasticity with respect to an input is equal to the output elasticity. This is because the firm cannot influence the price it receives. So, a 1% increase in input maybe leads to a 1% increase in output. This must lead to a 1% increase in revenue (prices don’t change). If we just wanted to estimate output elasticities for competitive firms (as was originally the case when the production-function estimation approach started), we wouldn’t have any problems.
But when a firm has market power, this equivalence breaks down. If the firm increases its output by 1%, this will lead to a decrease in price. So, revenue will increase by less than 1%. The revenue elasticity will be less than the output elasticity.
Now, recall that DEU estimates markups by dividing the output elasticity by the input’s revenue cost share. But since they don’t observe the output elasticity (because they don’t have data on quantities), they use the revenue elasticity instead.
But we just said that the revenue elasticity is the output elasticity divided by the markup. So, when you divide the revenue elasticity by the cost share, the markup cancels out! You’re always left with just the cost share divided by itself, which is one.
In other words, whenever a firm has any market power, the “markup” estimated using the revenue elasticity should always be one, regardless of what the true markup is. That’s why they say it’s completely uninformative. Moreover, if you don’t have input-quantity data, but only input expenditures, the problem applies twice.
DEU tries to control for this by including market share. They argue that, in some models, market share is sufficient to capture price differences. But this fix is only as good as the modeling assumptions. If there are other reasons for price variation, or if the specific demand structure doesn’t hold, the problem remains.
In a sense, the issue is that DEU wants to estimate a quantity elasticity, but they only have revenue and expenditure data. The price variables that convert quantities to revenues/expenditures are unobserved and can bias the estimates in complex ways.
I view this as a more severe problem than Miller does, in my reading of him. Bond et al. suggest that DEU estimates do not actually tell us anything about the level of markups, or how markups are changing over time.
Economists are working on other options, but haven’t settled on a solution. As with everything in cutting-edge research, no single paper is conclusive. Other papers suggest that, in practice, the problem is not so severe. For example, Maarten De Ridder, Basile Grassi, and Giovanni Morzenti have quantity data for French firms and argue that: “The level of markup estimates from revenue data is biased, but they do correlate highly with true markups.”
Heterogeneity in Demand
While we are in the weeds of estimation, there is one more potential problem that I glossed over. DEU doesn’t naively regress revenue on expenditures. They aren’t dumb. They rely on the Olley-Pakes (OP) or Levinsohn-Petrin (LP) procedure to estimate the output elasticity of a variable input. For this procedure to work as initially conceived, however, it assumes no differences in demand across firms or time that remain after controlling for observables. Ulrich Doraszelski and Jordi Jaumandreu suggest that this could be problematic when using OP/LP.
Why? The whole point of estimating markups is that we think firms might have some market power that allows them to charge prices above marginal cost. But the sources of that market power—things like product differentiation, branding, etc.—are precisely the kinds of demand differences that the OP/LP procedure assumes away. These procedures were designed for a world of perfect competition.
In other words, the DEU method is trying to measure markups, but it’s using a method that implicitly assumes away the sources of markup variation that we’re interested in. That’s what Doraszelski and Jaumandreu mean when they say the method is “circular.”
So what’s the alternative? Doraszelski and Jaumandreu (along with many others) point to other methods—like the dynamic-panel approach—that don’t suffer from this circularity problem, because they don’t rely on the OP/LP inversion. These methods have their own limitations, but are they better? Honestly, we (not just the dummy writing this blog post) don’t know at this point.
Miller is careful to note that none of these issues are unique to DEU; they are challenges that any study using the production approach must grapple with, especially if you don’t have quantity data. That’s a big deal for my own research, which uses DEU’s markups, but it may explain why we do not find DEU markups correlating with business entry.
It’s a problem for all the responses to DEU that do the same thing, which is most papers. Miller gives credit to DEU for the extensive robustness checks and alternative specifications that they explore in an effort to address these concerns. I completely agree.
At the same time, these challenges do suggest that some caution is warranted in interpreting the DEU estimates, especially when making economy-wide claims. The fact that industry-specific studies using different methods often find contrasting results only underscores this point.
To be clear, this is not to say that the DEU study is without value. Far from it. Their paper has been enormously influential in spurring new research and debate on the evolution of market power. And the fact that their broad findings seem to hold up under various alternative approaches is certainly suggestive.
Miller’s point, however (a good one), is that we should view the production-function estimates as one important piece of evidence in a larger puzzle, rather than as a definitive answer. We can build a more complete and nuanced understanding by triangulating their findings with those from other methods and more granular industry studies.
Industry Studies
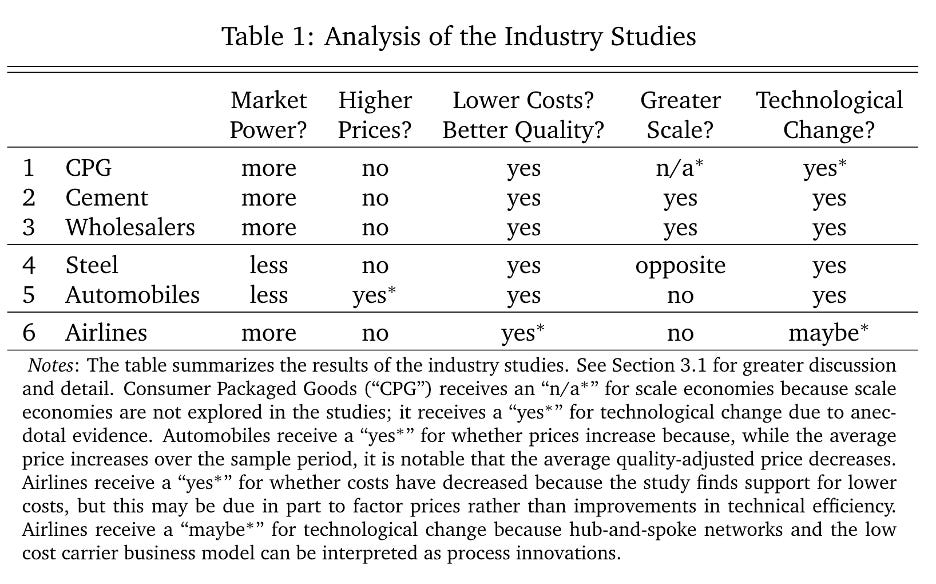
This brings us to the second part of Miller’s paper: the industry studies. IO economists have dug into specific industries—such as consumer packaged goods, cement, wholesaling, steel, autos, and airlines—over long time horizons. The advantage is that they can leverage industry knowledge and richer data to estimate more detailed models of competition. This allows them to better distinguish between different mechanisms driving long-run changes in markups. This loses generality, but gains information in the industries we study.
Take the study on consumer packaged goods (CPG) by Hendrik Döpper, Alexander MacKay, Nathan Miller (the same Nathan Miller), and Joel Stiebale (2023). Using retail-scanner data, they found that markups increased by about 30% on average from 2006-2019. But crucially, this was driven by falling marginal costs, rather than rising prices. Real prices were only 2% higher by 2019. The authors point to anecdotal evidence of CPG companies investing in cost-saving technologies and consumers becoming less price-sensitive over time. Other studies of consumer packaged goods find consistent results (James Brand, 2021; Enghin Atalay et al., 2023).
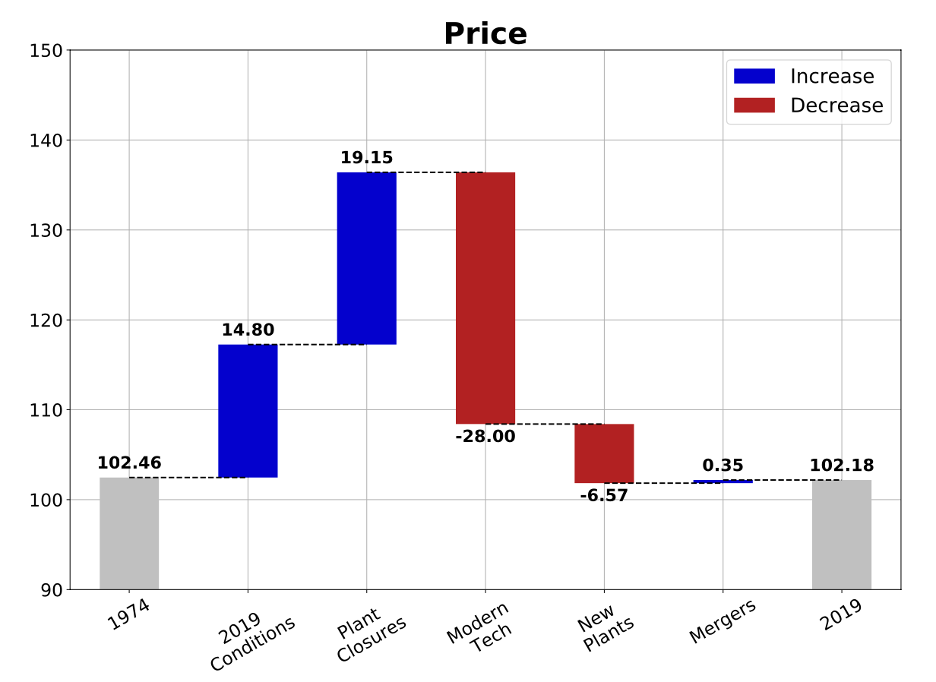
Miller et al. (2023) tells a related story in the cement industry. The industry saw a near 50% reduction in the number of plants from 1974-2019, yet prices remained stable. What explains this puzzle? It was the rise of precalciner kilns, which improved fuel efficiency, increased plant-level capacity, and generated greater economies of scale. Fewer-but-larger plants could meet demand more efficiently. Markups did rise modestly, but mainly due to this technological change, rather than declining competition per se.
Interestingly, the steel industry provides a counterpoint. Allan Collard-Wexler and Jan De Loecker (2015) find that the rise of mini-mill technology, which lowered the optimal plant size, led to falling markups from 1963-2002. The nature of technological change—whether it increases or decreases economies of scale—matters greatly for markups.
The auto industry is another case of falling markups, as Paul Grieco, Charles Murry, and Ali Yurukoglu (2023) documented. Here, significant improvements in quality (horsepower, fuel efficiency, features) raised marginal costs faster than prices from 1980-2018. Consumers gained from better vehicles, despite higher prices.
Wholesaling provides a final fascinating example. Sharat Ganapati (2024) finds that the growth of wholesalers from 1992-2012 can be understood through the lens of an endogenous sunk cost model, a la the under-appreciated John Sutton (1991). Greater trade and information-technology (IT) investments allowed these firms to expand product variety and geographic scope, generating economies of scale and raising markups, even as prices fell.
Miller summarizes the studies as follows:
There’s also research in between the macro studies and the industry studies, and that is the work on manufacturing, specifically. These studies have better data than Compustat, but are only for manufacturing.
Ivan Kirov and James Traina (2023) have plant-level production data and use more contemporary production-function estimation techniques (avoiding the Bond et al. critique). They do not find rising markups in manufacturing.
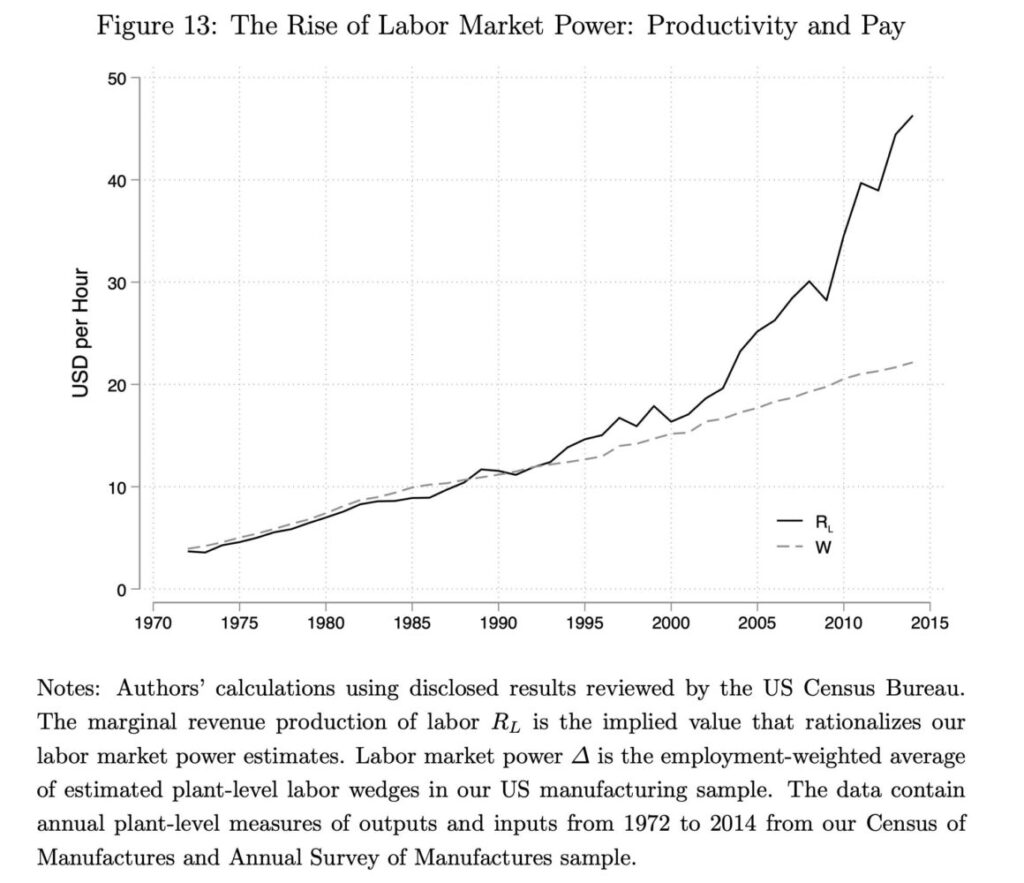
Instead, they find compelling evidence for a significant rise in labor-market power (or wage markdowns) in the U.S. manufacturing sector from 1972 to 2014. While firms paid production workers their marginal-revenue product in 1972, they only paid them half this amount by 2014.
That doesn’t sound great.
Strikingly, this increase in labor-market power is driven by an acceleration of the marginal revenue product of labor, particularly after 2000, rather than a stagnation of wage growth.
The authors provide several pieces of evidence pointing to technological change as a key driver of the rise in labor-market power. They find that changes in employer concentration and plant size have little explanatory power for the observed trends. Instead, direct measures of plant-level expenditures on information and communication technologies, as well as indirect measures of management and automation technologies (like the intensity of nonproduction labor and capital), are strongly associated with higher wage markdowns. The paper thus highlights the important role of technological change in shaping labor-market outcomes and calls for further research into the specific mechanisms at play.
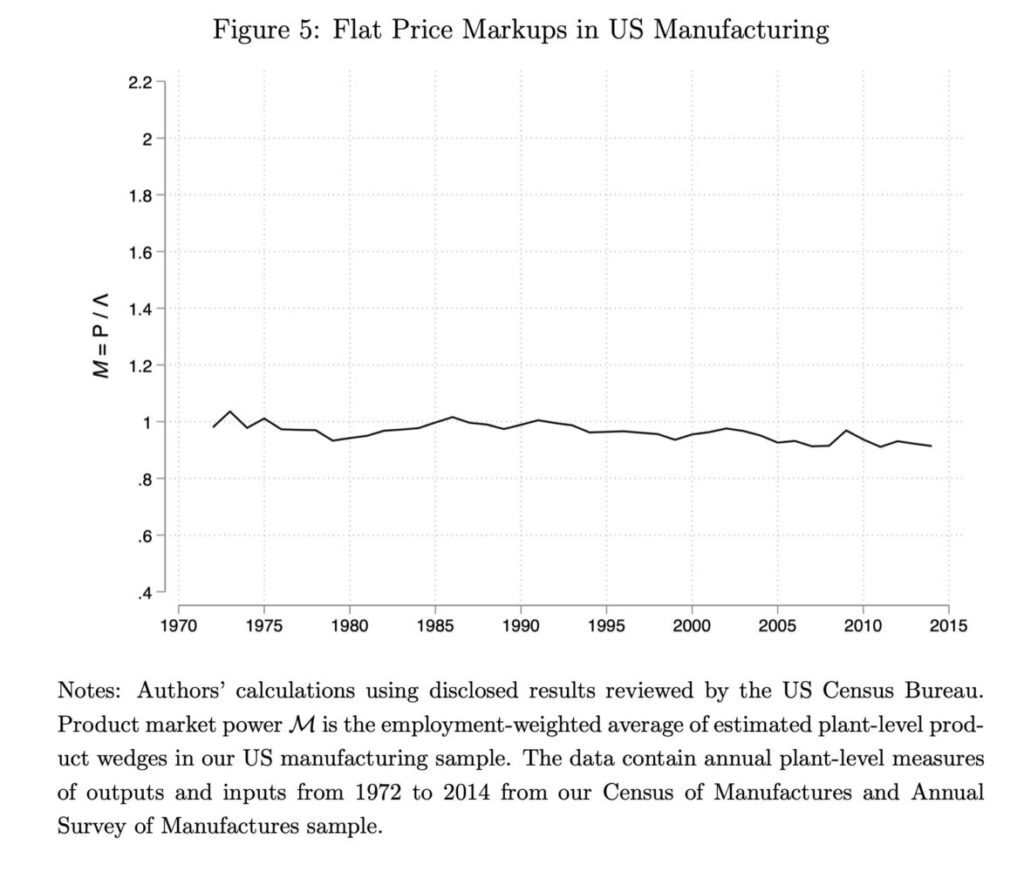
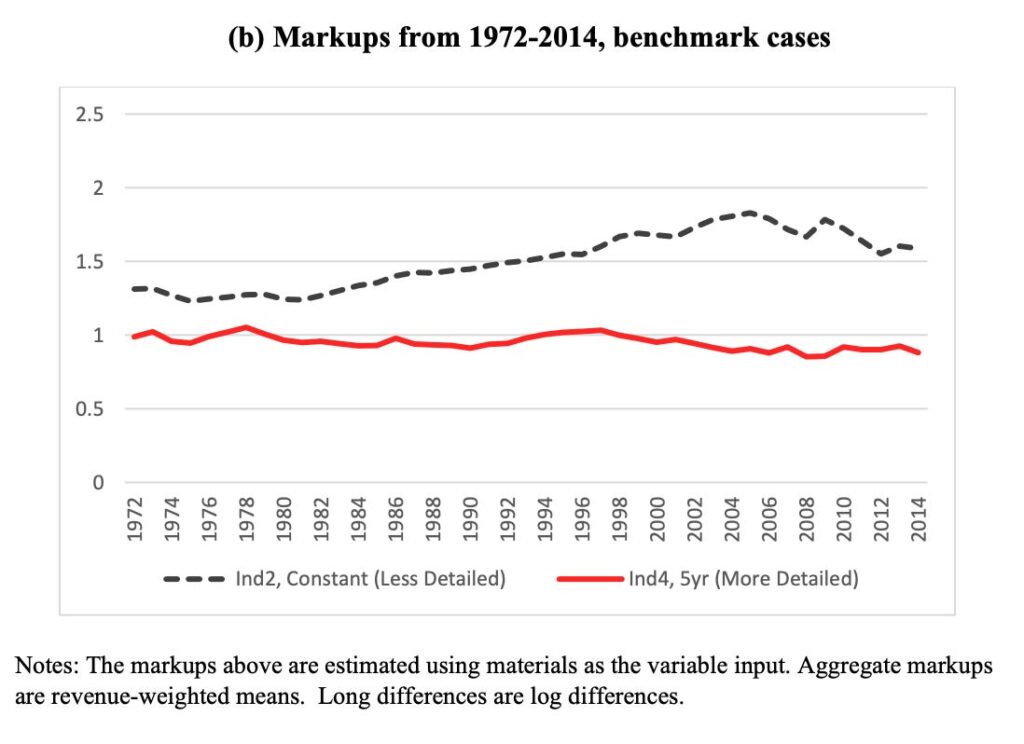
Similarly, with the more detailed data, Lucia Foster, John Haltiwanger, and Cody Tuttle (2024) allow output elasticities to vary extensively across establishments and over time. Allowing that, they argue that the increase in markups is substantially reduced, or even eliminated. In their most flexible specification, markups fall (see the red line below).
Supporting this, the authors relate differences in markup patterns to observable indicators of changing technology at the plant level, such as computer investment, capital intensity, and diversification into non-manufacturing. The results suggest that allowing for more detailed and time-varying production technologies absorbs much of the increase in markups, implying that changing technology—rather than rising market power—may account for the findings of earlier studies. The research highlights the importance of further investigating the causes and implications of heterogeneity in production technologies across businesses.
While the particulars differ, we see some common themes: Industry-specific technological innovations reshape cost structures, productivity, and product quality in ways that don’t always imply diminished competition. Falling costs are often passed through incompletely to prices, raising markups. And economies of scale can lead to rising concentration, yet stable or falling prices.
Miller is careful to note the limitations of industry studies. They tend to focus on markets with stable institutions and good data, which may be different from the broader economy. So, we shouldn’t overgeneralize. These studies typically assume a stable model of competition within each industry over time. They don’t fully allow for the possibility that the nature of competition itself might be evolving. Even when they allow for technological change, like the cement paper, how much is that capturing what we want to capture about changing markets?
For example, the rise of digital platforms, the growth of intangible assets, and the increasing importance of network effects may fundamentally change the competitive landscape in many industries. Static models of competition, even when estimated with rich industry-specific data, may struggle to capture these dynamics.
The studies do, however, provide valuable insight into the mechanisms behind markup patterns that purely national, accounting-based approaches like DEU cannot. By moving from macro to micro, we get a much richer picture of how competition, innovation, and welfare are evolving within industries.
As Miller suggests, combining this micro perspective with a macro dialogue could be fruitful. I agree. How can we better connect the insights from case studies to economy-wide trends? What can industry variation teach us about the critical drivers of markups, productivity, and welfare over time? There’s a lot more work to be done here.
In an ideal world, we want an approach that combines the broad, economy-wide scope of studies like DEU with the industry-specific detail and rigor of the IO studies. We want a method that can accommodate different models of competition, handle the complexities of real-world industries, and be applied at scale to give us a comprehensive view of markup trends.
DEU’s production approach is a valiant attempt at this ideal. By inferring markups from production data under relatively general assumptions, it tries to be both widely applicable and theoretically grounded. But as the critiques we’ve discussed show, it’s not clear that the method can fully deliver on this promise. The challenges of unobserved prices, unobserved demand shocks, and the inherent endogeneity of input choices may be insurmountable in this framework.
What Do We Know?
Despite the influential work of De Loecker, Eeckhout, and Unger, which seemed to provide compelling evidence of a broad-based rise in markups and market power, the true picture remains unclear. Critiques of their approach, along with more nuanced industry studies, suggest that the reality is complex and varied.
The limitations of both economy-wide and industry-specific studies, however, leave us with more questions than answers. While some industries have seen rising markups, others have experienced declines. Technological change, rather than weakening competition, appears to be a key driver. But that’s still quite a black-box. What’s technology? I don’t know.
I’d say we just don’t know what’s happening to markups. That’s frustrating for such a big question. But we should recognize that hard questions take work. DEU really ramped research up, but it’s far from settled.